Fact Sheets and InfographicsINFOGRAPHICS
Data Snapshots: Population, Education, Employment, Income and Poverty, and Computer and Broadband Access in Appalachia
The data snapshots below highlight topical data from the June 2020 report The Appalachian Region:
A Data Overview from the 2014–2018 American Community Survey.
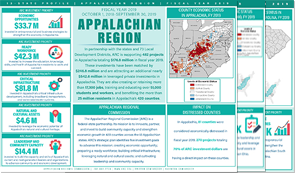
FACT SHEETS: STATE AND REGIONAL INVESTMENTS, FISCAL YEAR 2019
Learn about ARC's fiscal year 2019 investments in each of the 13 Appalachian states and Region-wide:
STATE INDUSTRIAL SNAPSHOTS
The fact sheets below illustrate employment share by industry in Appalachian counties in comparison to the rest of the state, and the country as a whole.
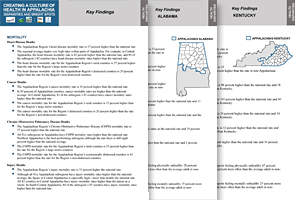
FACT SHEETS: HEALTH DISPARITIES IN APPALACHIA
The fact sheets below summarize recent key findings on health measures for the Appalachian Region
and for each of the 13 Appalachian states. Source: Health Disparities in Appalachia, August 2017
|


