Incubator FinancesRespondents to the 2004 ARC incubator survey were asked several questions related to the finances of their programs. One question pertained to their overall operating budget, while other questions focused on the level and source of operating subsidies. The average (mean) annual operating budget for an Appalachian incubator is just less than $290,000. In comparison, the average annual operating budget among respondents to NBIA's 2002 State of the Incubation Industry study was about $365,000. The range of annual operating budgets in the 2004 ARC survey is dramatic; it goes from a low of $15,000 to a high of $1.7 million. To be consistent with the exclusion of five large incubators from the earlier calculation of the average-sized Appalachian incubator, a similar analysis was prepared that excluded the operating budgets from the same set of incubators. This yielded an average Appalachian incubator annual operating budget of just less than $273,000. A final, and perhaps more useful, analysis was completed that excluded the responses from incubators whose annual budgets were either two standard deviations greater or less than the mean. This process removed the incubators with the five largest budgets. The resulting average operating budget came to slightly more than $219,000 for the group, with a range of $15,000 to $761,000. As illustrated in Table 8, it appears that Appalachian incubators have considerably smaller operating budgets than do incubators nationally. Some of the difference might be explained by a lower cost of living in Appalachia relative to the nation as a whole. However, it is believed that at least part of the difference indicates that Appalachian incubators are less likely to generate operating revenues to cover their operating budgets. This theory can be tested by reviewing the 2004 ARC survey responses regarding operating subsidies, below.
Survey respondents were asked three questions relative to subsidization of their programs:
Figure 11. Financial Status of Appalachian Incubators 
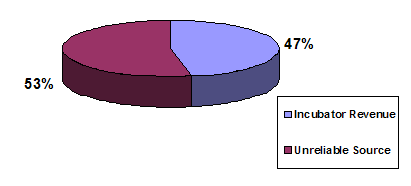
Figure 12. Percentage of Self-Sustaining Appalachian Incubator Budgets from Outside Sources After eliminating those incubators that are self-sustaining (20 percent) and self-sufficient (28 percent), the remaining 52 percent of Appalachian incubators require an insecure source of funding to maintain operations. The responses of these incubators that are neither self-sufficient nor self-sustaining indicate that, on average, they receive a subsidy of 53 percent of their operating budget from unreliable external sources (see Figure 13). Figure 13. Percentage of Budget from Unreliable Sources in Appalachian Incubators That Are Not Self-Sufficient or Self-Sustaining 
Both good and bad news can be derived from the analysis of these results. First the good news:
Now the bad news:
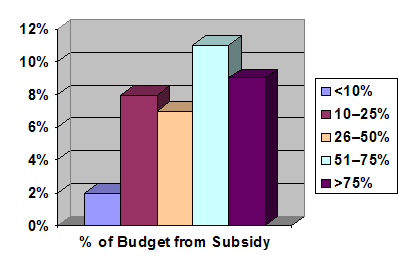
Simply put, about half of Appalachian incubators are at risk of closure because of their heavy dependence on unreliable funding sources. While one might argue that this is an overstatement of the situation, since the 53 percent represents an average subsidy requirement of these non-self-sustaining, non-self-sufficient incubators, Figure 14 paints a clearer picture of the problem by showing the range of subsidies as a percentage of an incubator's budget. The data suggest that perhaps 10 of these at-risk incubators are in the survivability range (requiring a subsidy of 25 percent or less), while another 27 are at greater risk, with subsidy requirements ranging from 26 percent to 100 percent of their operating budgets. It is also worth noting that anecdotal evidence suggests that incubator managers can be unrealistically optimistic about the stability and longevity of certain governmental funding sources. Figure 14. Percent of Budget from Subsidy 
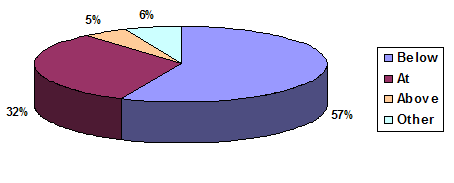
Another potential source of the operational funding difficulties was identified when respondents provided information about the structure of their rental rates. Figure 15 shows that 57 percent of respondents said their rental rates were below market, while only 5 percent indicated that they had above-market rates. It is difficult, if not impossible, for a business incubator to achieve financial self-sustainability, much less self-sufficiency, if it does not charge at least market rate for the space that it leases. Figure 15. Rental Rates in Appalachian Incubators 
| |||||||||||||||||||||||
